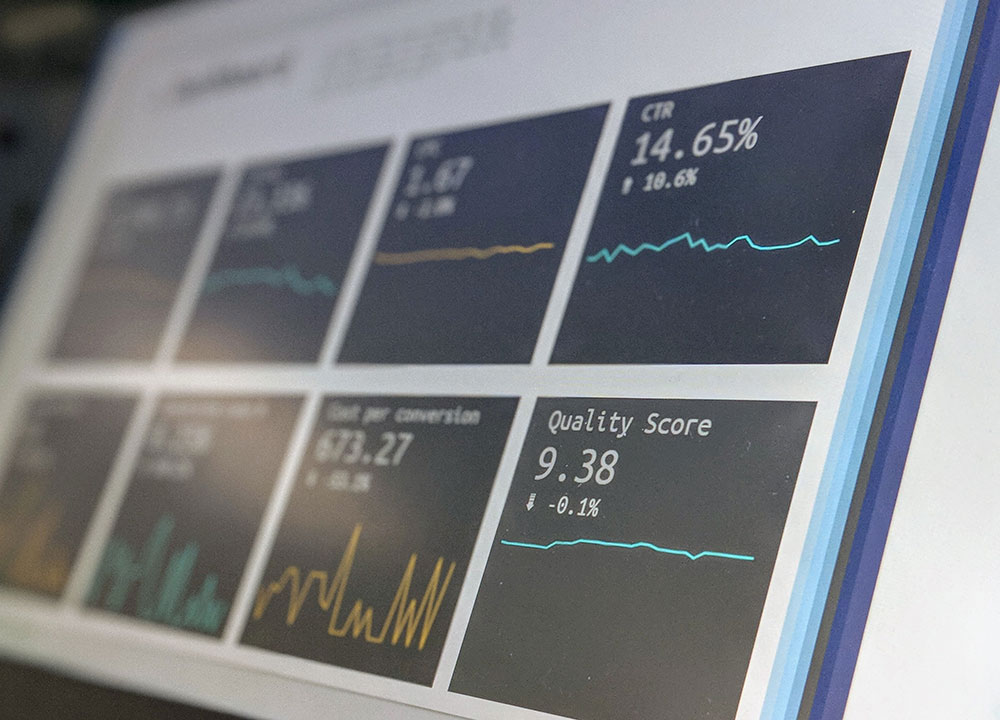
Data Analytics Dashboard

Dashboard is a tool that visually displays and summarizes data from various sources to provide insights and facilitate decision-making. By presenting key metrics in an easily understandable way, users can quickly identify trends, patterns, and anomalies within the data, helping organizations make informed choices and improve performance.
Demystifying the data deluge: The power of data analytics dashboards
In today’s data-driven world, businesses are constantly bombarded with information. But how do you turn this raw data into actionable insights? Enter the data analytics dashboard, a powerful tool that transforms complex data sets into clear, visual representations, empowering informed decision-making.
Unlocking insights at a glance
A data analytics dashboard is essentially a digital cockpit that provides a centralized view of key metrics and performance indicators (KPIs) from various sources. This can include data from:
- Sales & marketing: Track website traffic, conversion rates, campaign performance, and customer acquisition costs.
- Finance: Monitor revenue streams, expenses, budgets, and financial health.
- Operations: Analyze production efficiency, resource utilization, and identify potential bottlenecks.
- Customer service: Gain insights into customer satisfaction, identify support trends, and track resolution times.

The art of visualization: Why dashboards matter
Data analytics dashboards go beyond just presenting data. They leverage the power of visual storytelling, using charts, graphs, and other visual elements to:
- Simplify complex data sets: Transforming numbers into visuals makes them easier to understand and identify trends.
- Highlight key metrics: Dashboards prioritize the most crucial information, allowing users to focus on what matters most.
- Spot anomalies and trends: Visual representations can quickly reveal unusual patterns or emerging trends that might be missed in raw data.
- Drive data-driven decisions: Easy access to insights empowers users to make informed choices based on concrete evidence.
The benefits of embracing data analytics dashboards
By implementing data analytics dashboards, organizations can unlock a multitude of benefits:
- Improved performance: Data-driven decision-making leads to better resource allocation, optimized processes, and ultimately, improved business performance.
- Enhanced collaboration: Dashboards provide a shared understanding of key metrics, fostering better collaboration across departments.
- Increased transparency: Data visualization promotes transparency and accountability within organizations.
- Faster response times: Real-time insights allow for quicker identification and response to potential issues.
Data analytics dashboards are not a magic bullet, but they are a powerful tool for any organization seeking to extract value from their data. By leveraging clear visualizations and fostering a data-driven culture, businesses can make smarter decisions, optimize performance, and gain a competitive edge.